A series is one set of numbers in the report: a plan, actuals, or the variance between two others. Series live on the shelf inside a Columns segment.
Add a series
- Plan — drag a plan from the Plans section of the library onto the Series shelf. Its label defaults to the plan name.
- Actual — click + Actual on the shelf or drag the Actuals tile.
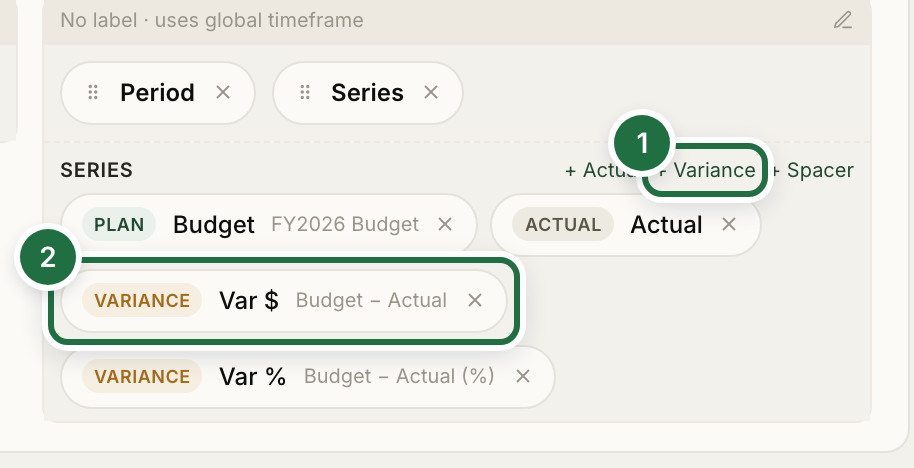
- Variance — click + Variance (1) once the shelf has at least two plan or actual series. It is wired to compare the last two automatically.
- Spacer — click + Spacer to add a visual gap between series.
Click any chip, such as Var $ (2), to configure it.
Drag chips to reorder them. Removing a series also removes any variance that depended on it.
Configure a series
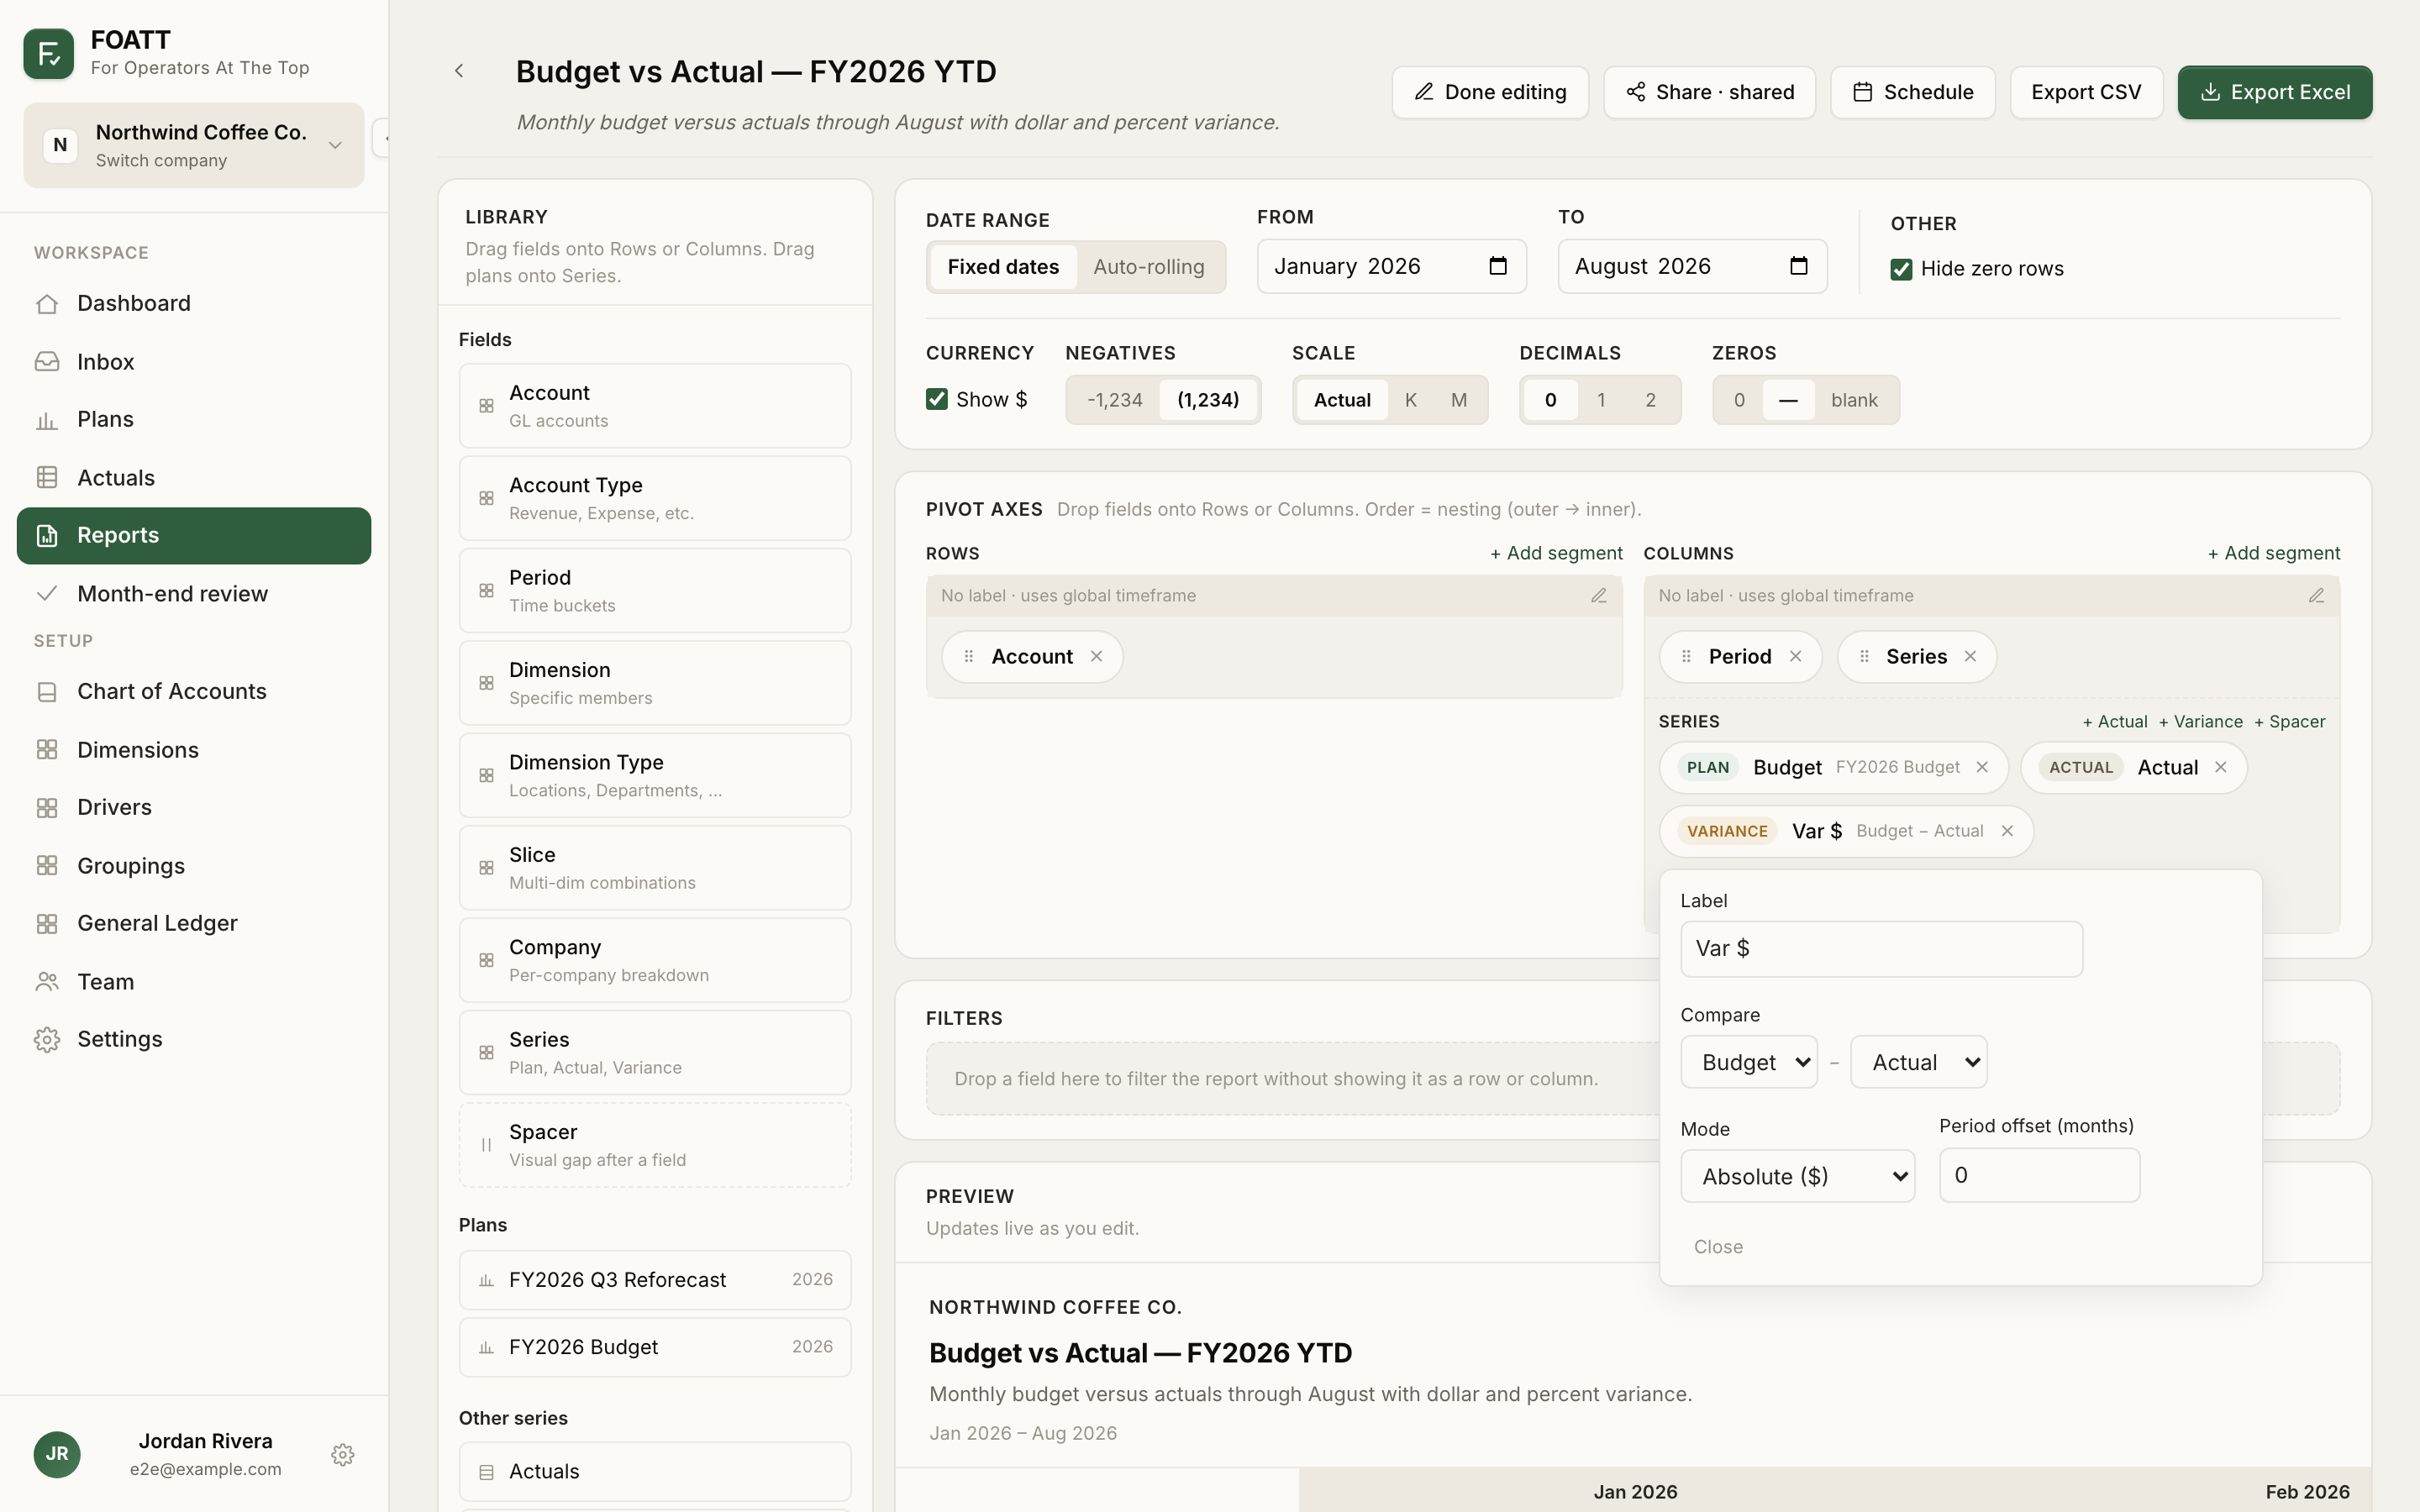
Click a chip to open its inspector:
| Field | Applies to | What it does |
|---|---|---|
| Label | All | The column header |
| Plan | Plan | Which plan version to read |
| Compare | Variance | The two series being compared, shown as right − left |
| Mode | Variance | Absolute ($) or Percent (%) |
| Period offset (months) | Plan, Actual | Shift which months the series reads |
How variance is calculated
Variance is right minus left as shown in the Compare field, so Actual − Budget is positive when actual is higher than budget. There is no sign flip for expense accounts: a positive variance on Rent means you spent more than planned. Percent mode divides by the absolute value of the left side and is left blank when that side is zero.
If one side has no data it counts as zero, so a plan with no actuals still shows a variance.
Compare against prior year
Set Period offset (months) to -12 on an Actual series to show the same month of the previous year in each column. Combined with an offset-0 Actual and a variance between them, you get a year-over-year report:
| Series | Offset | Label |
|---|---|---|
| Actual | 0 | This year |
| Actual | −12 | Last year |
| Variance (This year − Last year) | — | YoY $ |
The offset applies only to what the series reads; the column headers still show the report's own months.
Two plans side by side
Drag two plans onto the shelf — for example the original budget and a reforecast — and add a variance between them to see how the forecast moved.