Date range
The Date range control at the top of the builder has two modes:
- Fixed dates — pick From and To months. The report always covers exactly this window.
- Auto-rolling — pick a Window and the range moves forward on its own. Options are This month, Last month, This quarter, Last quarter, This year, Last year, Year to date, and Trailing 3, 6, or 12 months. A footnote shows the months the window resolves to today.
Trailing and year-to-date windows end with the previous complete month, so a scheduled report always covers settled periods. Auto-rolling is the right choice for any report you plan to email on a schedule.
Month, quarter, and year columns
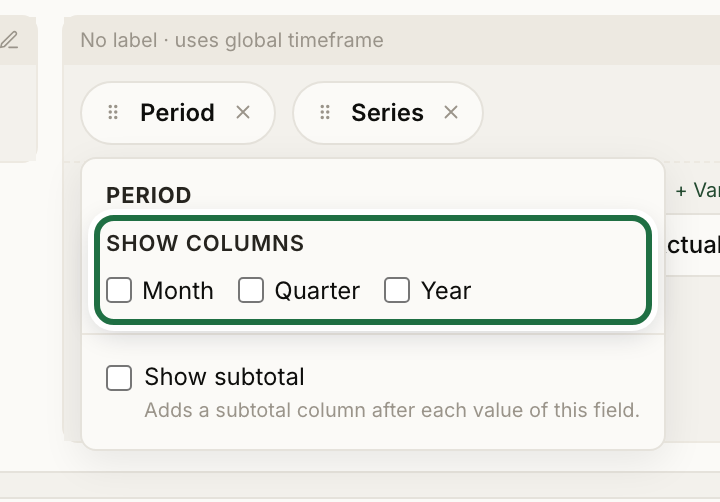
Granularity lives on the Period chip. Click it and tick Month, Quarter, or Year under Show columns. You can tick more than one, for example months plus a year total.
Number formatting
| Control | Options |
|---|---|
| Currency | Show $ on or off |
| Negatives | -1,234 or (1,234) |
| Scale | Actual, K (thousands), M (millions) |
| Decimals | 0, 1, or 2 |
| Zeros | 0, —, or blank |
| Hide zero rows | Drop rows that are zero across every column |
When scale is K or M the report header and exports note Values in thousands or Values in millions. Cells with no data at all always show a dash, whatever the Zeros setting. The same settings carry into the Excel export as native number formats.
Segments with their own timeframe
Each Rows or Columns lane can hold more than one segment, and a segment can override the report's date range. Click the pencil on a segment header, untick Use the report's global timeframe, and set fixed dates or a rolling preset. This is how you put Q1 actuals and Full-year budget in the same report as separate column groups. Use + Add segment to add another.